Joint Research Group Macromolecular Crystallography
Structure of the month - January 2005
Nature Vol. 430, 2004, Pages 803-806
Structure of molybdopterin-bound Cnx1G domain links molybdenum and copper metabolism
Jochen Kuper1,3, Angel Llamas1, Hans-Jürgen Hecht2, Ralf R. Mendel1, and Günter Schwarz1,4
1 Department of Plant Biology, Technical University, Spielmannstr. 7, D-38106 Braunschweig, Germany
2 German Research Center for Biotechnology, Mascheroder Weg 1, D-38124 Braunschweig, Germany
3 Present address: EMBL Hamburg outstation, DESY, D-22603 Hamburg, Germany
4 Corresponding author: g.schwarz@tu-braunschweig.de
Abstract
The molybdenum cofactor (Moco) is part of the active site of all molybdenum (Mo)-dependent enzymes1, except nitrogenase. As catalytic center Moco plays important roles in the global carbon, sulphur and nitrogen cycles. Mo enzymes are important for diverse metabolic processes, such as sulphur detoxification and purine catabolism in mammals or nitrogen assimilation and phytohormone synthesis in plants. Human Moco deficiency results in the pleiotropic loss of all Mo enzyme activities with neurological abnormalities and early childhood death. Moco consists of molybdopterin (MPT), a phosphorylated pyranopterin with an ene-dithiolate coordinating Mo. The same pyranopterin-based cofactor is involved in metal coordination of the homologous tungsten-containing enzymes found in archea. Moco is synthesized by a highly conserved biosynthetic pathway.
In plants, the multi-domain protein Cnx1 catalyzes the insertion of Mo into MPT. The Cnx1 G domain (Cnx1G), whose crystal structure has been determined earlier in its apo-form, binds MPT with high affinity and participates in the catalysis of Mo insertion. We have determined two high-resolution crystal structures of Cnx1G in complex with its substrate MPT and with adenylated MPT (MPT-AMP), a novel mechanistically important intermediate. MPT-AMP is the reaction product of Cnx1G and is subsequently processed in a magnesium-dependent reaction by the C-terminal E domain of Cnx1 (Cnx1E) to yield active Moco.
In both structures, to substrate and product bound forms of Cnx1G a strong anomalous signal has been observed between the MPT dithiolene sulphurs, which has been identified as bound copper using multi-wavelength anomalous scattering. The observed inhibition of Moco synthesis by Cu suggests a new link to copper transport disorders where some of the symptoms might be attributed to Moco deficiency. However, this Cu-Mo-antagonism is the opposite of the known Mo-Cu-antagonism where increased molybdate causes Cu-deficiency due to the formation of Cu-chelating thiomolybdates.
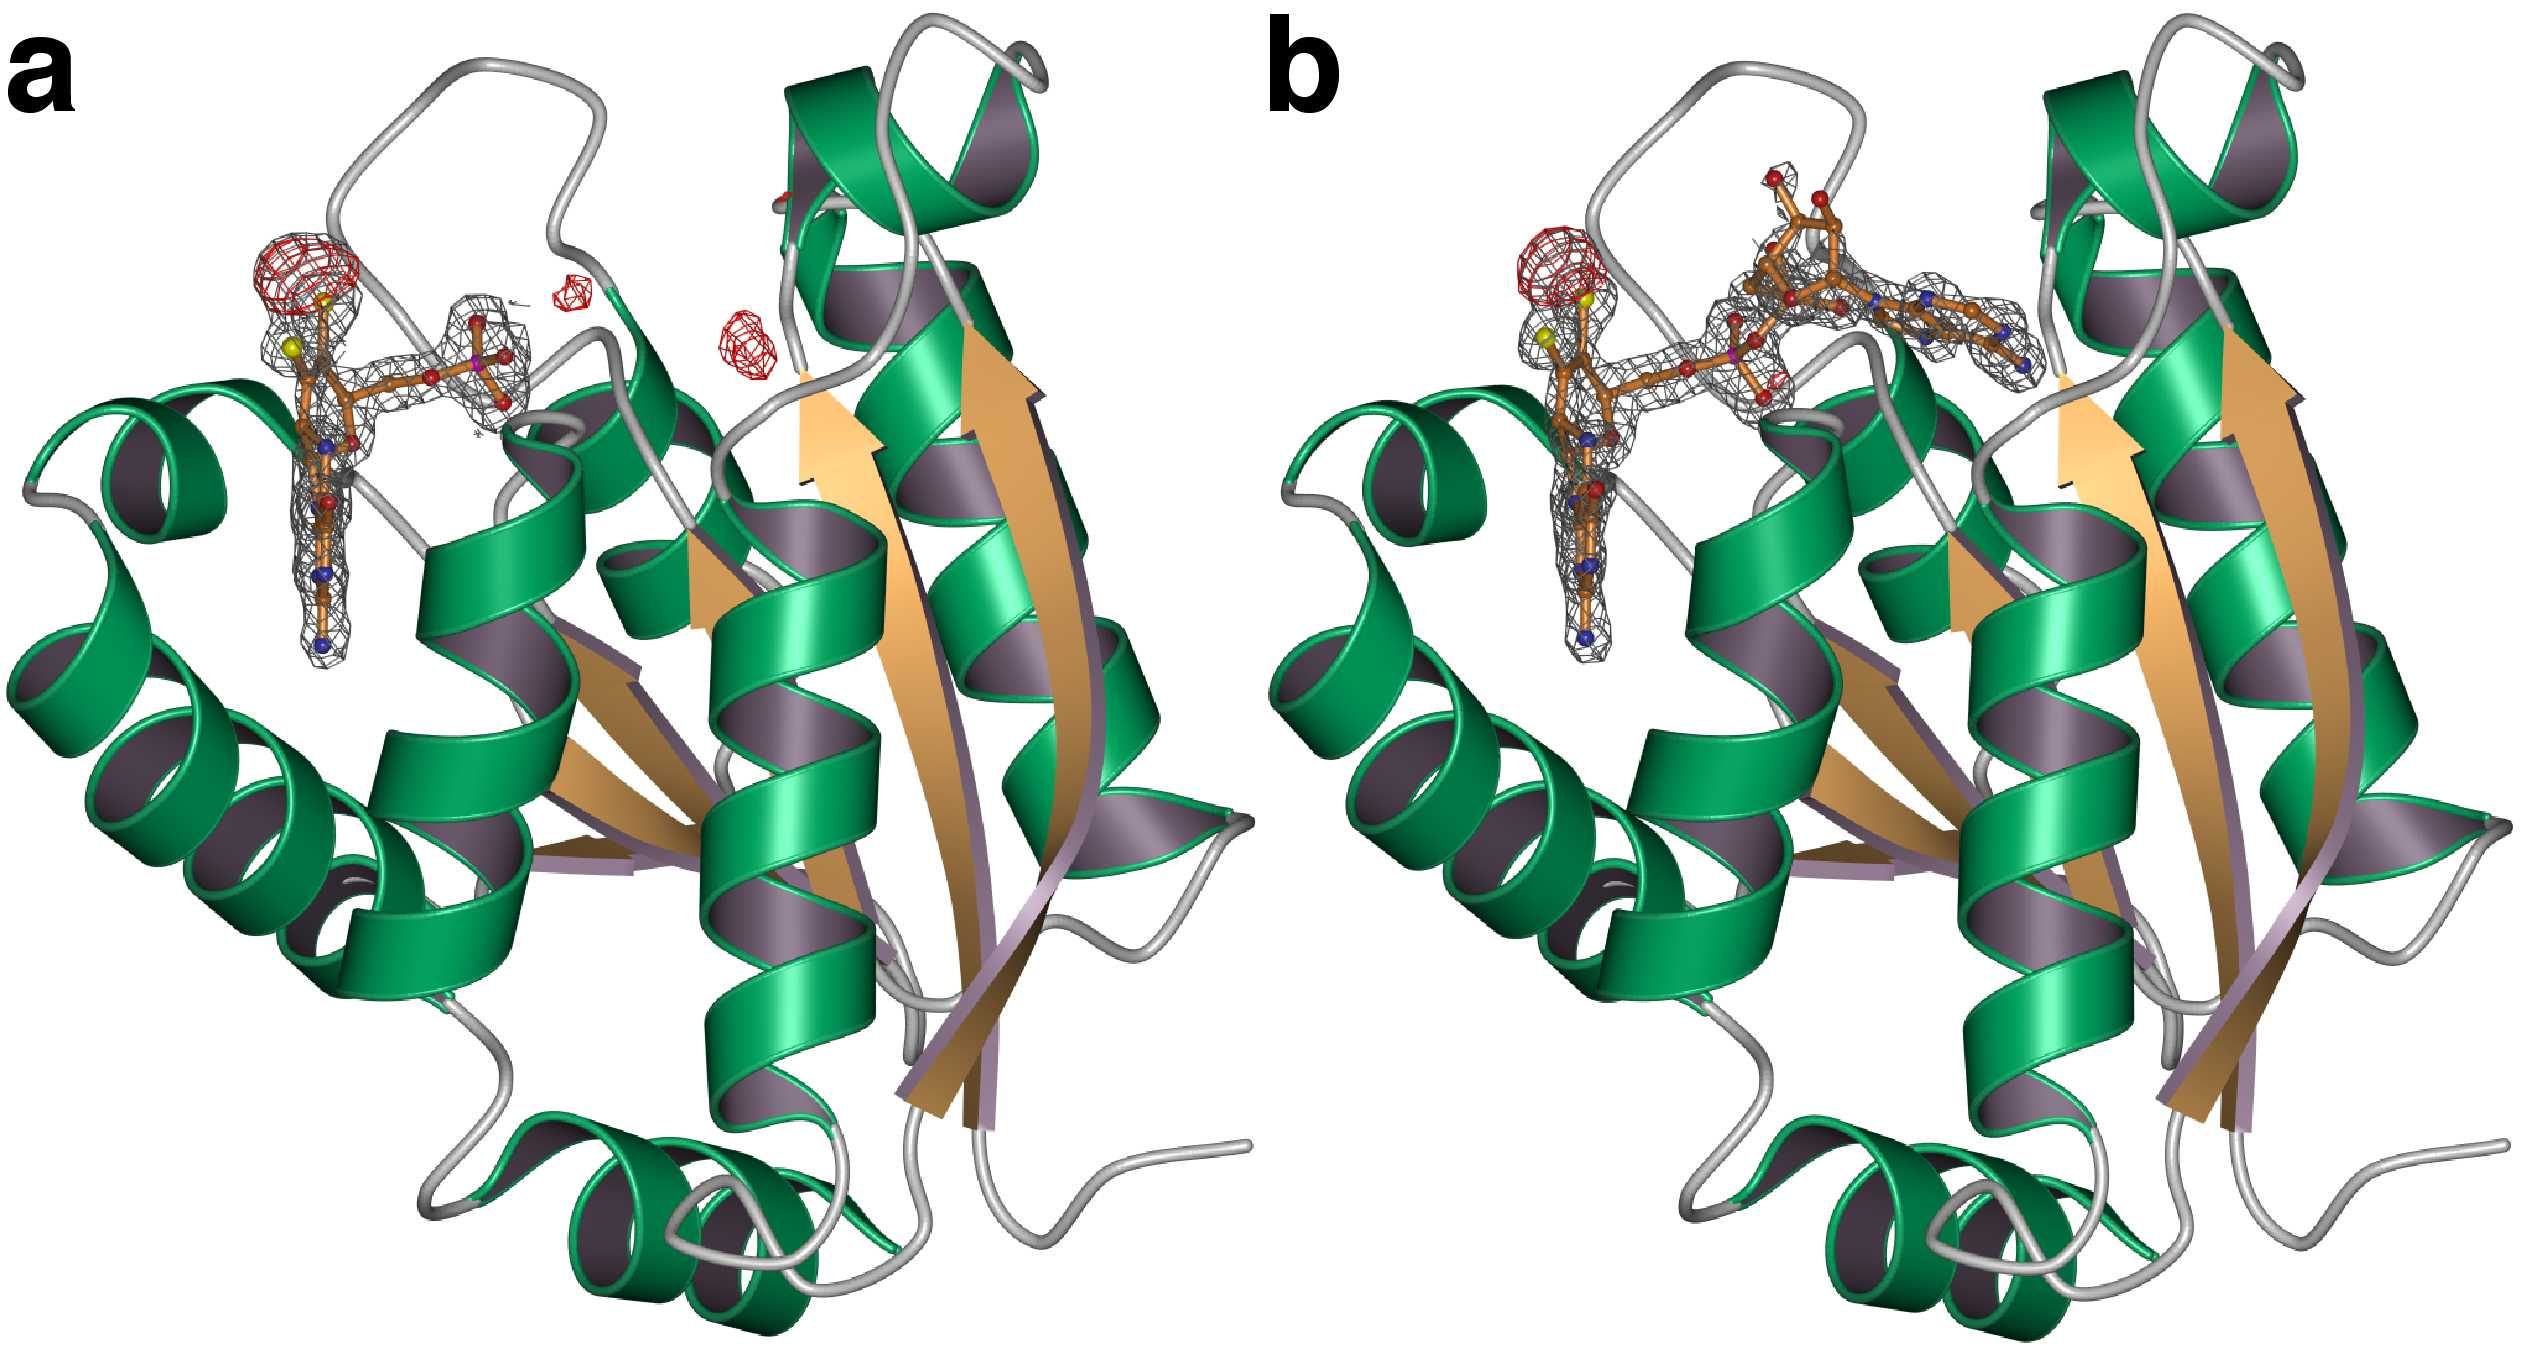
Figure 1. The structure of Cnx1G-MPT (a, substrate) and S583A-MPT-AMP (b, product) complexes. Ribbon representation of Cnx1G (a) and S583A (b). Green and orange colouring indicates helices and β-strands. Bound MPT and MPT-AMP are shown in ball-stick-mode covered by the 2Fo-Fc electron density contoured at 1.0 sigma. Difference density (Fo-Fc) is shown in red (3.5 sigma).

Figure 2. Cu-MPT dithiolate complex. a, Fluorescence scan of Cnx1G crystal at the Cu absorption edge. b, Anomalous Fourier maps (coloured) from diffraction data recorded at 1.05 Å (blue, 5.0 sigma) and 1.75 Å (yellow, 3.0 sigma) of S583A surrounding the Cu-site and 2Fo-Fc maps (grey) for non-dithiolate ligands. Dashed lines indicate bonds between Cu and coordinating atoms.
Data collection | ||||||||
|---|---|---|---|---|---|---|---|---|
| Data set*I* | WT-1 | WT-2 | WT-3 | WT-4 | S583A-1 | S583A-2 | ||
| Wavelength (Å) | 1.050 | 1.377 | 1.385 | 1.750 | 1.050 | 1.750 | ||
| Max. Resolution (Å) | 1.60 | 1.90 | 1.90 | 1.85 | 1.45 | 1.80 | ||
| Completeness*II* | 99.9 (100) | 99.6 (99.6) | 97.6 (97.6) | 100 (100) | 99.3 (99.9) | 97.0 (97.0) | ||
| Completenessano*II* | 99.8 (100) | 99.8 (100) | 97.3 (99.7) | 99.8 (99.8) | 99.9 (100) | 94.6 (90.8) | ||
| Mean Redundancy | 7.7 (7.6) | 8.0 (8.0) | 8.1 (7.9) | 7.5 (7.3) | 6.9 (6.7) | 5.6 (5.6) | ||
| Rsym*II**III* | 5.7 (39.0) | 6.5 (29.6) | 9.0 (53.0) | 6.0 (36.8) | 5.5 (40.0) | 6.6 (45.8) | ||
| I/sigI*II**IV* | 7.6 (1.9) | 9.2 (2.4) | 6.5 (1.3) | 7.8 (1.8) | 6.3 (1.8) | 9.0 (1.8) | ||
| Number of reflections | 28748 | 17573 | 16897 | 18910 | 36739 | 19640 | ||
Refinement | ||||||||
|---|---|---|---|---|---|---|---|---|
| Data set | WT-1 | S583A-1 | ||||||
| Resolution limits (Å) | 20-1.6 | 27-1.45 | ||||||
| Number of reflections | 27323 | 36122 | ||||||
| Number of protein / solvent atoms | 1216 / 155 | 1215 / 168 | ||||||
| Rcryst / Rfree (%)*V* | 16.5 / 19.1 | 16.3 / 17.9 | ||||||
| Deviations from ideal values in Bond distances (Å) Angles (°) Torsion angles (°) Chiral-center restraints (Å3) Plane restraints (Å) | 0.014 1.509 4.972 0.198 0.006 | 0.012 1.450 4.850 0.184 0.005 | ||||||
| Ramachandran statistics | 93.4/6.6/0/0 | 94.1/5.9/0/0 | ||||||
Table. Data collection and refinement statistics.
*I* All crystals belong to space group F4132 (a=b=c=171.1 Å).
*II* Numbers in parentheses correspond to the highest resolution shell.
*III* Rsym = ∑hkl∑i |Ii - | / ∑hkl∑i Ii where Ii is the ith measurement and is the weighted mean of all measurements of I.
*IV* /
*V* Rcryst=∑hkl||Fo|-|Fc||/∑hkl|Fo| where Fo and Fc are the observed and calculated structure factor amplitudes. Rfree same as Rcryst for 5% of the data randomly omitted from refinement. The number of reflections includes the Rfree subset. Ramachandran statistics indicate the fraction of residues in the most favored, additionally allowed, generously allowed, and disallowed regions of the Ramachandran diagram as defined by PROCHECK [Laskowski, R. A., et al. J. Mol. Biol. 231, 1049-67 (1993)].