Joint Research Group Macromolecular Crystallography
Structure of the month - February 2007
J. Biol. Chem. Vol. 281, October 2006, Pages 30186-30194
Structure of the Molybdenum Cofactor Carrier Protein
Katrin Fischer1,5, Angel Llamas1,2, Manuel Tejada-Jimenez1,2, Nils Schrader1,3, Jochen Kuper4, Farid S. Ataya2, Aurora Galvan2, Ralf R. Mendel1, Emilio Fernandez2, and Guenter Schwarz1,5,*
1 Institute of Plant Biology, Technical University Braunschweig, 38106 Braunschweig, Germany
2 Departamento de Bioquímica y Biología Molecular, Universidad de Córdoba, Córdoba 14071, Spain
3 Department of Structural Biology, Max-Planck-Institute of Molecular Physiology, 44247 Dortmund, Germany
4 European Molecular Biology Laboratory (EMBL) outstation, 22603 Hamburg, Germany
5 Institute of Biochemistry, University of Cologne, 50674 Cologne, Germany
*Correspondence:
Guenter Schwarz
Institut für Biochemie, Universität zu Köln
Otto-Fischer-Str. 12-14
D-50674 Köln, Germany
Phone: 49-221-470-6432
Fax: 49-221-470-6731
E-mail: gschwarz@uni-koeln.de
Abstract
The molybdenum cofactor (Moco) forms the catalytic site in all eukaryotic molybdenum enzymes and is synthesized by a conserved multi-step biosynthetic pathway. The mechanism of transfer, storage, and insertion of Moco into the appropriate apo-enzyme is poorly understood. Recently a unique Moco carrier protein (MCP) has been identified and characterized in the eukaryotic green algae Chlamydomonas reinhardtii (Ataya et al., 2003; Witte et al., 1998).
We have determined the crystal structure of MCP at 1.6 Å resolution at BESSY Beamline BL14.1 using seleno-methionated and native protein. The monomer constitutes a Rossmann fold with two homodimers forming a symmetrical tetramer in solution (Fig. 1). Strikingly, all MCP monomers observed in two different crystal forms share a disordered surface loop (residues 70-76). Based on detailed analyses, including shape (Fig. 2A), charge distribution (Fig. 2B), and conservation (Fig. 2C), this region was proposed to represent the Moco-binding site. In silico docking studies, structural comparison as well as the identification of an anion binding site further supported this hypothesis. Finally, structure-guided mutagenesis in combination with substrate binding studies (Fig. 2D) confirmed this region as the Moco-binding site.
Reference
Ataya, F.S., Witte, C.P., Galvan, A., Igeno, M.I. and Fernandez, E. (2003) Mcp1 Encodes the Molybdenum Cofactor Carrier Protein in Chlamydomonas reinhardtii and Participates in Protection, Binding, and Storage Functions of the Cofactor. J. Biol. Chem., 278, 10885-10890
Witte, C.P., Igeno, M.I., Mendel, R., Schwarz, G. and Fernandez, E. (1998) The Chlamydomonas reinhardtii MoCo carrier protein is multimeric and stabilizes molybdopterin cofactor in a molybdate charged form. FEBS Lett., 431, 205-209.

Figure 1. Structure of C. reinhardtii MCP monomer (A) and tetramer (B). Residues G70 and I76 that border a stretch of delocalized residues are highlighted.
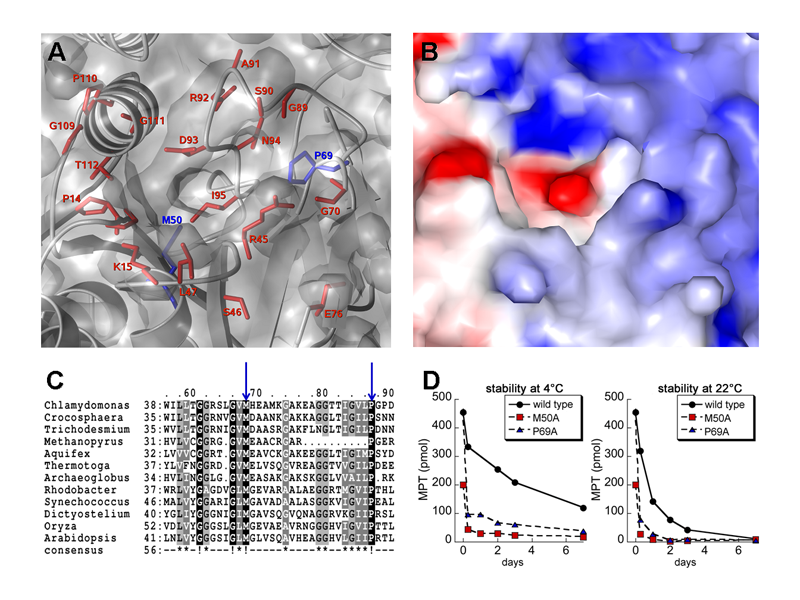
Figure 2. Substrate-binding site of MCP. (A) Transparent surface view with residues that are highly flexible highlighted in red and residues that were subjected to structure-based mutagenesis highlighted in blue. (B) Electrostatic surface potential. (C) Sequence alignment of MCP residues 38-75 with homologous proteins from Crocosphaera watsonii (EAM49636), Trichodesmium erythraeum (EAO26031), Methanopyrus kandleri (NP_614673), Aquifex aeolicus (NP_213091), Thermotoga maritima (NP_228861), Archaeoglobus fulgidus (AAB90115), Rhodobacter sphaeroides (EAP67917), Synechococcus sp. (YP_381580), Dictyostelium discoideum (EAL66951), Oryza sativa (BAD46468), and Arabidopsis thaliana (AAM64859). The alignment was generated with ClustalW and the first residue of each sequence line is shown. (D) Stability of Moco bound to MCP wild type and mutant variants M50A and P69A at 4°C (E) and 22°C. 1000 pmol wild type and mutant protein were incubated the indicated times and Moco content was determined by HPLC analysis.
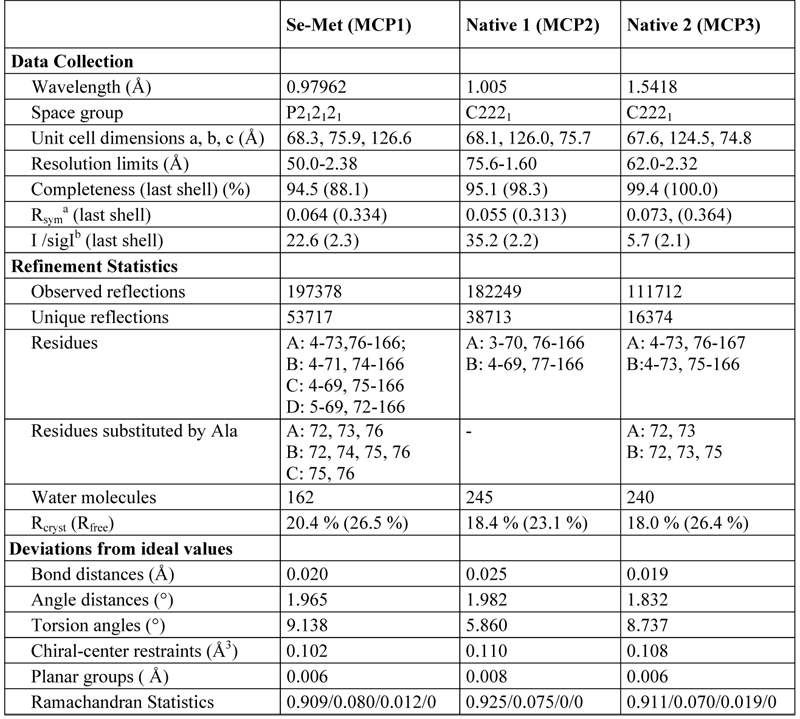
Table 1. X-ray data collection and refinement statistics.
Rsym =ΣhklΣi|Ii - (I)| ΣhklΣi(I) where Ii is the i-th measurement and (I) is the weighted mean of all measurements of I. (I)/(σI) indicates the average of the intensity divided by its average standard deviation. Rcryst =Σ||Fo| - |Fc|| / Σ|Fo| where Fo and Fc are the observed and calculated structure factor amplitudes. Rfree same as Rcryst for 5% of the data randomly omitted from the refinement. Ramachandran statistics indicate the fraction of residues in the most favored, additionally allowed, generously allowed, and disallowed regions of the Ramachandran diagram, as defined by PROCHECK.