Department Microstructure and Residual Stress Analysis
Instrument Control & Data Acquisition

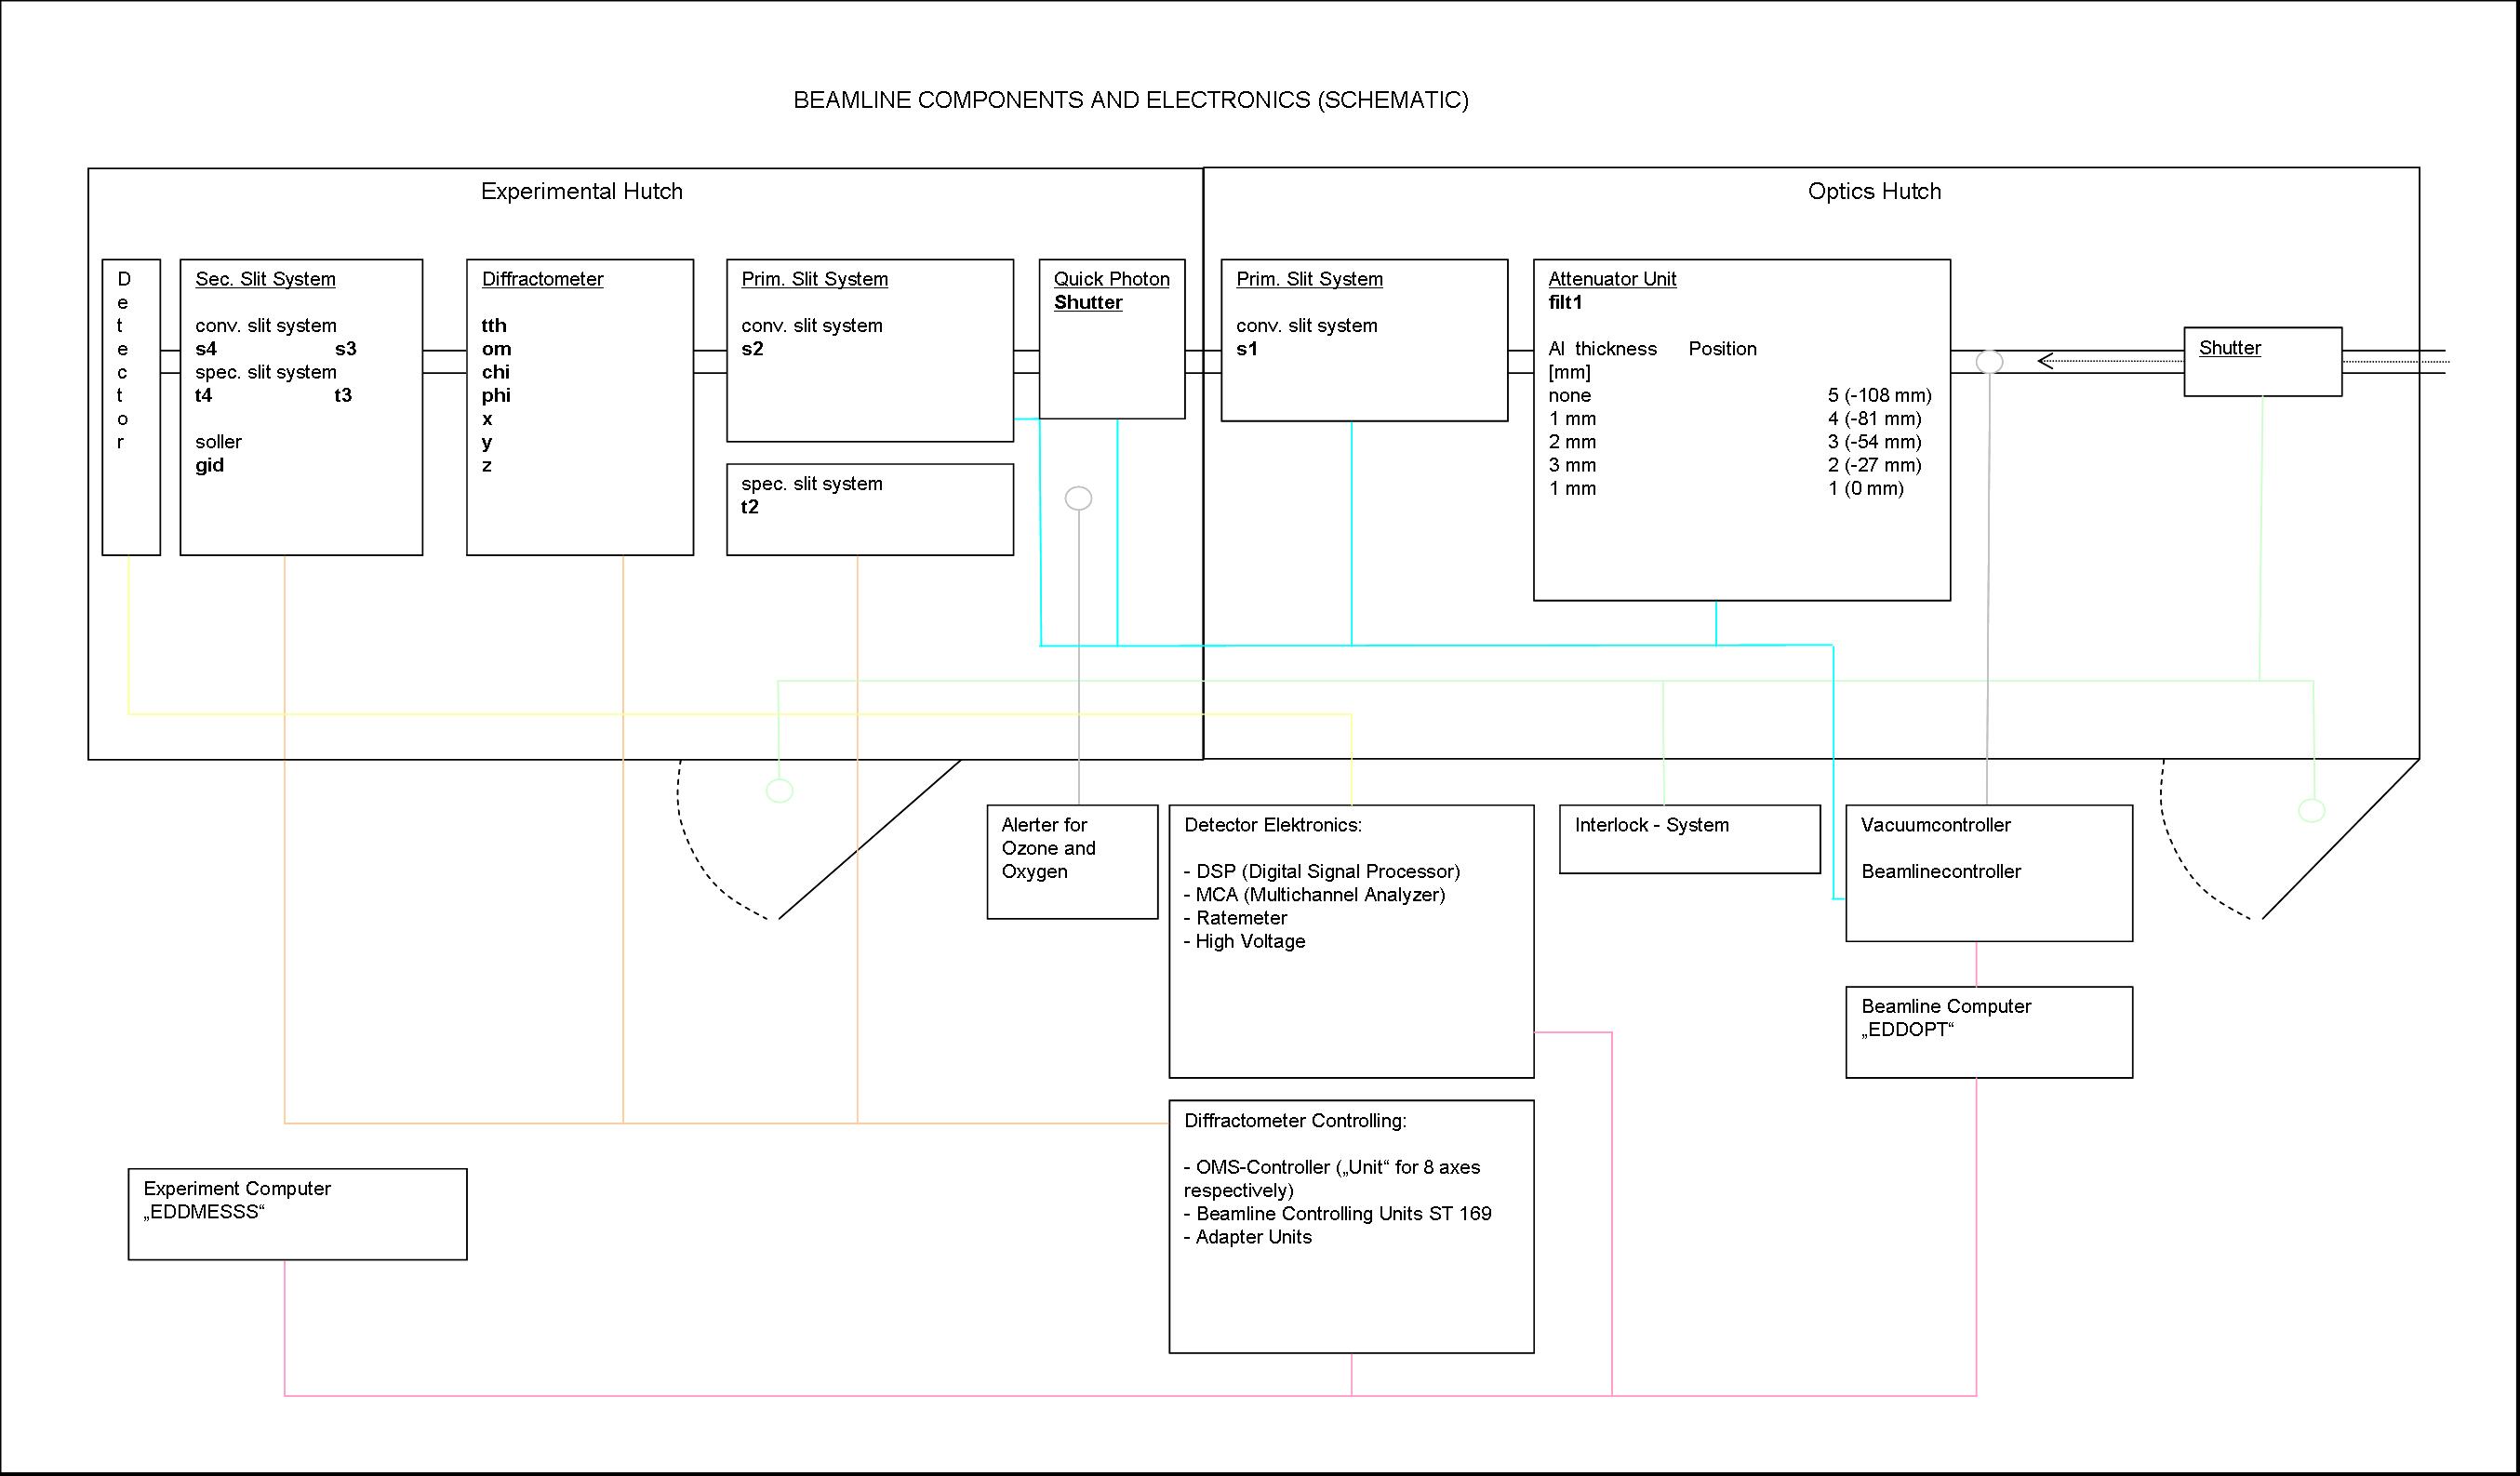
For instrument control and data acquisition we use spec, which is a UNIX-based software package widely used for X-ray diffraction at synchrotrons (for details see http://www.certif.com).
The ASCII data file usually contains beamline data (beam current), all diffractometer data (motor positions) as well as various detector data (counts per channel, calibration data, acquisition time). For individual applications additional data, such as temperature and pressure, may be collected by means of the Keithley digital multimeter 2700. For detailed information about the Keithley see http://www.keithley.de.
A handout containing all basic spec commands for our application is available for download (108 kB).
Support
Infrastructure at Experimental Station
| electrical power supplies: | 220 V, 16 A 400 V, 16 A |
| cooling water: | available |
| pressurized air: | 8 bar |
Available Software (Linux)
| Xplot 2.1 | Xplot is for creating X-Y graphics which also allows sophisticated data visualization, processing, manipulation and analysis. |
| for more information see http://www.esrf.fr/computing/scientific/xop |
Available Software (Windows)
| mathematica 4.0 | various mathematica notebooks already exist, which allow the preparation of the measurement (basic calculations), the compilation of the experiment command files and the conversion and analysis of data, i.e. standard residual stress analysis procedures |
| origin 6.1 | graphic and data analysis software |
| corel 10 | versatile graphics program |
| Xplot 2.1 | Xplot is for creating X-Y graphics which also allows sophisticated data visualization, processing, manipulation and analysis. |
| JCPDS | Diffraction data |
| office 2000 pro | standard microsoft office programs |