Institute Solar Fuels
(Photo)electrochemistry
In general, all common electrochemical measurement techniques are available at the institute. Numerous potentiostats and bi-potentiostats are available. The most commonly used methods are electrochemical impedance spectroscopy (EIS), cyclovoltametry (CV), chronoamperometry (CA) and chronopotentiometry (CP). Some of our methods are described in more detail below.
Cyclic voltammetry (CV)
In cyclic voltammetry, the working electrode (WE, i.e., the sample) potential is swept linearly versus time. Three-electrode configuration is usually used, with Ag/AgCl as the reference electrode (REF) and metal wire (e.g., Pt) as the counter electrode (CE). The current measured by the potentiostat is then plotted as a function of applied potential.
In our lab, measurements are typically performed under dark (no illumination) and AM1.5 illumination. Class AAA solar simulator is used to provide a good match to the AM1.5 spectrum, which is monitored using a calibrated photodiode. A shutter can also be used in order to provide chopped illumination. The difference between the current under illumination and the dark current is the photocurrent, which is one of our materials’ key performance metrics.
The schematic of the setup (Fig. a) and typical CV curves of BiVO4 (Fig. b), one of our most well-studied photoelectrodes, are shown below.

©HZB/Abdi
Incident Photon-to-Current Efficiency (IPCE) measurement
This measurement is also called external quantum efficiency (EQE) measurement, especially in the field of photovoltaics. In photoelectrochemistry, IPCE values define the ratio of the number of electrons collected in the outer circuit to the number of incident photons. The setup itself consists of the followings: (i) a lamp capable of producing white light illumination (typically Xenon lamp or tungsten-halogen lamp), (ii) a monochromator to tune the illumination wavelength to the desired one, (iii) a shutter, (iv) a series of long pass filters, (v) a photoelectrochemical cell connected to a potentiostat, and (vi) a calibrated photodiode to measure the incident photons. The schematic of the setup is shown below (Fig. a).
By scanning the wavelength output of the monochromator, an IPCE spectrum (see example below, Fig. b) can be generated. The performance of the sample under investigation at various wavelengths can therefore be examined.

©HZB/Abdi
Intensity Modulated Photocurrent Spectroscopy (IMPS)
In IMPS experiments, the intensity of illumination is modulated in order to modulate the surface concentration of photo-generated carriers. Using a frequency response analyzer (FRA), the modulated complex photocurrent is measured. A simplified model, illustrated in literature by Peter et al.,[2] is then used to analyze the competition between hole transfer (i.e., hole injection into the electrolyte) and surface recombination at the semiconductor/electrolyte interface. From this analysis, one can extract the values of the reaction rate constants for charge transfer, ktr, and surface recombination, krec. A schematic of our setup (Fig. a), and examples of IMPS spectrum (Fig. b) as well as the extracted rate constants (Fig. c) are shown below.

©HZB/Abdi
(Photo-)Electrochemical Impedance Spectroscopy
In electrochemical impedance spectroscopy (EIS) measurement, we provide a small ac modulation of potential to the working electrode and measure the resulting modulated current. Complex impedance can thus be calculated by dividing the applied potential with the measured current. Frequency scan is typically done, and the resulting complex impedance can be plotted in a Nyquist plot, where the x-axis is the real impedance and the y-axis is the imaginary impedance (see below example, Fig. a). By fitting the impedance spectrum with an equivalent circuit, processes at the photoelectrode (bulk and surface) can be investigated. A light source can also be used to investigate the processes under illumination. The schematic of a typical setup is shown below (Fig. b).

©HZB/Abdi
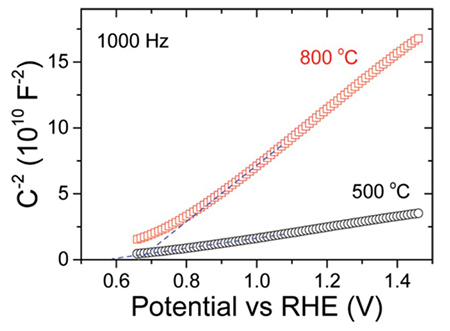
One important measurement that is typically done on semiconducting photoelectrode is the Mott-Schottky measurement, where the space charge capacitance (Csc) of the semiconductor is measured with varying applied potential. Csc can be determined from the fitting of the Nyquist plot above, or can be measured at frequency range where only Csc is affected by changing the potential. Mott-Schottky plot can be constructed by plotting Csc-2 as the y-axis and applied potential as the x-axis (see example below). From the linear slope of this curve, donor/acceptor concentration (ND/NA) can be calculated, and from the x-axis intercept, the flatband potential (Vfb) can be determined.
©HZB/Abdi
Spectroelectrochemistry
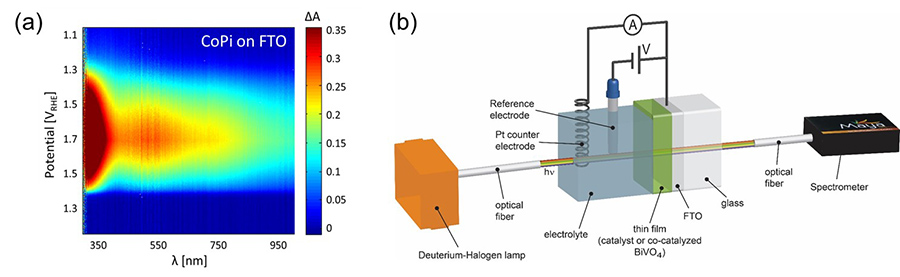
This measurement technique aims to monitor changes in the optical transmission (or absorption) of the sample in-situ during electrochemical measurements. This is particularly useful for tracking a certain oxidation/reduction reaction within a catalyst layer, as each oxidation states of a catalyst typically has a certain optical signature. For example, a colorplot shown below (Fig. a) is the change in absorption (ΔA) for a cobalt phosphate (CoPi) catalyst measured in-situ during electrochemical cyclic voltammetry. It is clear that by applying different potential, the optical absorption spectrum of the CoPi catalyst changes. Optical changes on the surface of a semiconductor during water reduction or oxidation reaction can also be monitored, although the sensitivity is much lower due to the limited change (only surface, not bulk). The schematic of our spectroelectrochemistry setup is shown below (Fig. b).
©HZB/Abdi
Differential electrochemical mass spectrometry
This technique allows the detection of gaseous or volatile products, which were formed at the working electrode in (photo)electrochemical reactions. This is achieved by coupling the electrochemical cell to a mass-spectrometer via a gas permeable membrane. Depending on the distance between this membrane and the working electrode, which is determined by the design of the cell, a response time of several seconds is achieved for the product detection. This allows the simultaneous measurement of potential, current, and corresponding product distribution in a (photo)electrochemical reaction as well as the determination of the Faraday efficiencies and the onset potentials of product formation or corrosion processes.

©HZB/Bogdanoff
In-line Detection of products by gas-chromatography and mass-spectrometry
Gaseous products (e.g. H2, O2, CH4, CO) which were formed in a (photo)electrochemical cell were carried out by an auxiliary carrier gas flow (Ar or N2) and detected at the gas-outlet of the device by a gas-chromatograph (GC) or mass-spectrometer (MS). A calibration procedure allows the calculation of the corresponding Faraday efficiencies. In contrast to the DEMS technique, which needs highly specialized cells and electrodes, this technique can be applied to a broad range of normally used photoelectrochemical cells. The response time for a product, is about 10-20 sec for the mass spectrometer and about 20 min for GC. The latter is due to the time-consuming separation of products in the collumn of the gas chromatograph.